Measuring What Matters
Wellbeing Metrics That Drive Improvement
School leaders are fluent in data. You track growth in literacy, interrogate NAPLAN trends, and examine attendance patterns with precision. But when it comes to student wellbeing, many schools still rely on instinct, anecdote or isolated pastoral indicators.
In a climate of rising psychological distress amongst adolescents and increasing accountability to boards and communities, that gap is no longer sustainable. If wellbeing is central to learning, then it must be measured with the same rigour as academic achievement.

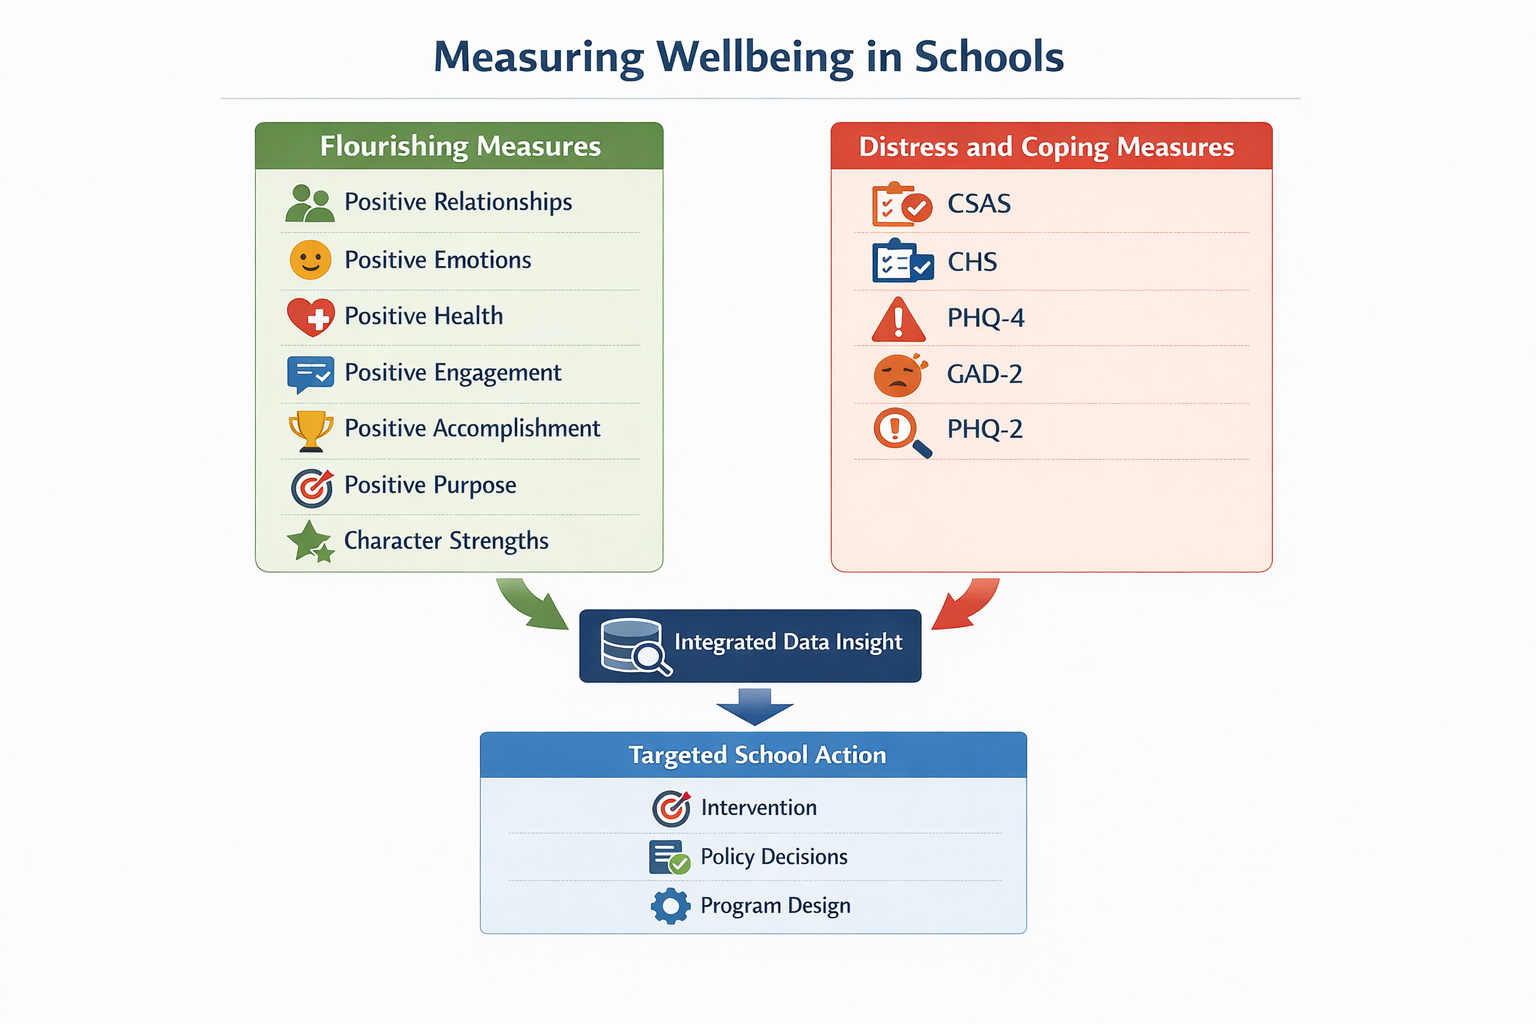
Over the past decade, research has shifted wellbeing from a peripheral concern to a core educational priority. Multidimensional models demonstrate that flourishing encompasses positive emotion, engagement, relationships, meaning and accomplishment (Kern et al., 2015). These domains are not merely desirable; they are predictive.
Longitudinal evidence shows that students’ subjective wellbeing is reciprocally related to academic engagement over time (Datu & King, 2018). In other words, wellbeing both influences and is influenced by how students participate in learning. When students feel hopeful, purposeful and connected, they are more likely to persist, invest effort and achieve.
At the same time, epidemiological data highlight concerning trends in adolescent anxiety and depressive symptoms. Validated screening measures such as the PHQ-4 and GAD-2 are now widely used to detect early psychological distress in youth populations (Löwe et al., 2010; Kroenke et al., 2006). Schools are uniquely positioned to notice early shifts in these patterns, but only if they are measuring them systematically.
The implication for leaders is clear: without robust metrics, wellbeing work cannot be evaluated, improved or credibly defended.
What High-Quality Measurement Looks Like
Not all wellbeing surveys are equal. For decision makers, four criteria are important:
- Conceptual rigour: grounded in contemporary wellbeing theory.
- Psychometric validity: including reliability, factor structure, and predictive utility.
- Developmental appropriateness: suitable for children and adolescents.
- Actionability: data that informs improvement, rather than just description.
Multidimensional Measurement
Kern et al. (2015) demonstrated that applying a multidimensional framework to student populations yields richer diagnostic insight than single-item life satisfaction measures. Distinct domains (e.g., engagement versus relationships) show unique associations with academic and behavioural outcomes. This supports the case for comprehensive, domain-based instruments.
Similarly, research in personality and positive psychology indicates that strengths use, hope and purpose uniquely predict adaptive functioning after controlling for symptom measures (Datu & King, 2018). Therefore, schools require tools that capture both flourishing and distress.
The Role of Strengths and Hope
Empirical work published in the Journal of School Psychology highlights that constructs such as hope are not peripheral traits; they are linked to goal pursuit, persistence and resilience in adolescents (Datu & King, 2018). The Children’s Hope Scale (Snyder et al., 1997) has demonstrated strong reliability and predictive validity in youth samples.
For school leaders, this means measuring strengths and aspirational constructs is not “soft”. It is strategically aligned with academic functioning.
Monitoring Psychological Distress
Screening tools such as the PHQ-2, PHQ-4 and GAD-2 have strong psychometric support for detecting depressive and anxiety symptoms (Kroenke et al., 2006; Löwe et al., 2010; Spitzer et al., 2006). When embedded ethically and with appropriate safeguards, these measures allow schools to identify emerging risks at a population level.
However, symptom-only measurement is insufficient. Australian research in adolescent wellbeing emphasises that flourishing and distress operate on related but distinct continua (Boyes & Hermens, 2026). High wellbeing does not simply mean low anxiety. Comprehensive tools must assess both.
Using Data for Decision-Making and Improvement Cycles
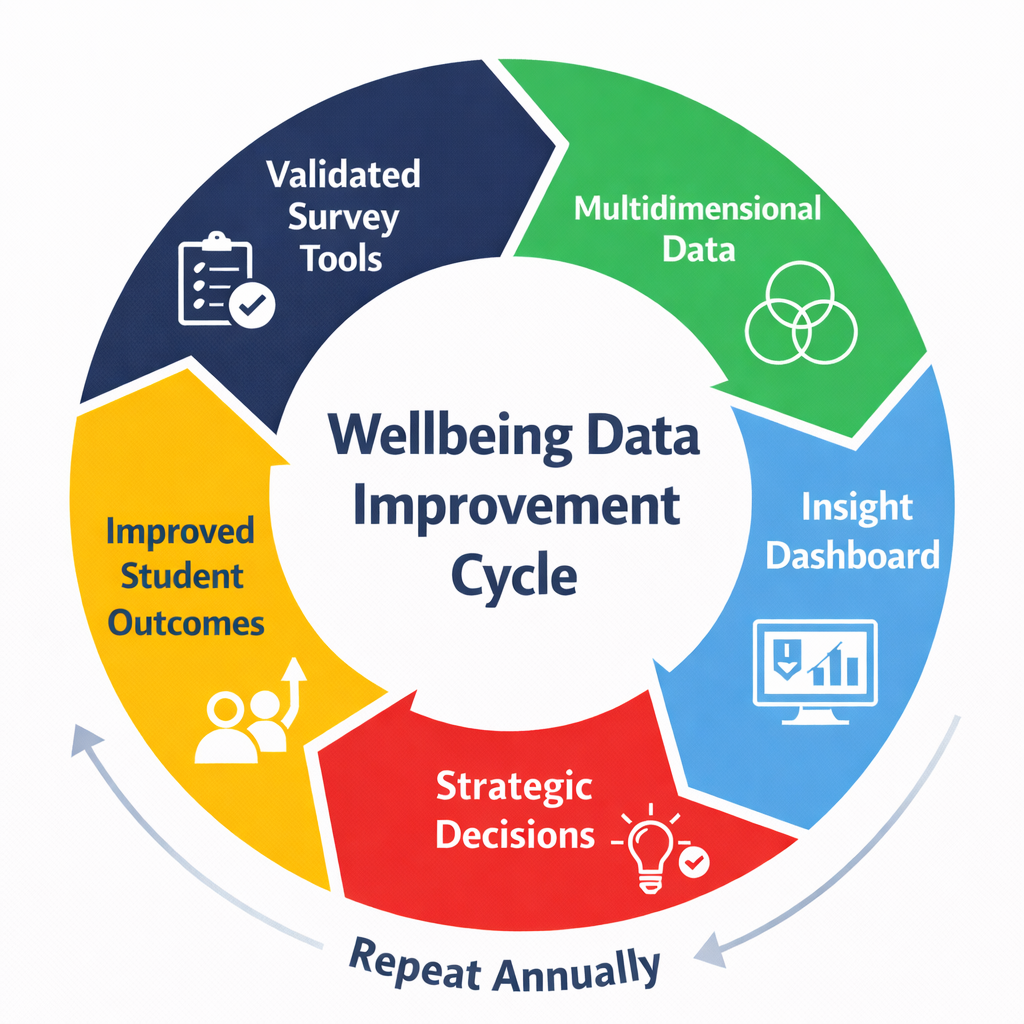
Measurement becomes transformative when embedded within disciplined improvement cycles.
Step 1: Diagnose with Precision
Aggregate cohort data allows leaders to identify domain-specific strengths and pressure points. For example:
- Strong relationships but low engagement
- High purpose but emerging anxiety in senior years
- Gender or year-level differences in accomplishment
Multidimensional profiles provide clarity for targeted intervention.
Step 2: Design Strategic Responses
When data reveals low engagement, schools might prioritise instructional design and student voice initiatives. If anxiety scores are elevated, evidence-based emotion regulation interventions could be implemented. If purpose is low, mentoring or strengths-based career guidance may be warranted.
Importantly, decisions are anchored in evidence rather than perception.
Step 3: Deliver and Monitor
Re-administration of the same validated instrument enables longitudinal tracking. Datu and King (2018) conceptualise the dynamic nature of engagement and wellbeing over time. Without repeated measurement, schools cannot detect whether change is occurring.
Step 4: Demonstrate Impact
For boards and governing bodies, impact data strengthens strategic accountability. Clear trend lines over multiple years provide defensible evidence of return on investment in wellbeing initiatives.
In effect, wellbeing becomes integrated into the school’s performance architecture, not siloed within pastoral care.
Linking Wellbeing Data to Academic Outcomes
For some schools, the most compelling argument for systematic wellbeing measurement is its relationship to learning outcomes.
Datu and King (2018) showed clear links between different wellbeing areas and student engagement, and found that positive wellbeing factors predict helpful academic outcomes even after accounting for symptoms of stress or distress. Engagement is also strongly linked to academic performance and persistence, reinforcing why it matters in school settings.
Kern et al. (2015) demonstrated that dimensions such as engagement and accomplishment are uniquely related to school functioning. Students reporting higher wellbeing exhibit stronger adaptive behaviours and more positive academic attitudes.
From a cognitive perspective, positive affect broadens attention and enhances cognitive flexibility, while chronic anxiety narrows attentional scope and impairs working memory. Therefore, wellbeing data can function as an early indicator of academic vulnerability.
For leaders seeking alignment between academic strategy and pastoral care, wellbeing metrics provide a bridge. They enable proactive, preventative responses rather than reactive crisis management.
……………………………………………………………………………………
The evidence base is clear. Student wellbeing is multidimensional, measurable and meaningfully associated with academic engagement and achievement.
Without systematic measurement:
- Interventions cannot be evaluated.
- Resources cannot be strategically allocated.
- Impact cannot be credibly demonstrated.
With rigorous, validated metrics embedded in improvement cycles, wellbeing becomes a lever for sustained school improvement.
For schools seeking a comprehensive, psychometrically grounded tool aligned with contemporary wellbeing science, the Mi7 Survey, developed by the Institute of Positive Education in collaboration with Resilient Youth Australia and the University of South Australia, offers a multidimensional framework incorporating validated measures of flourishing, strengths and psychological distress. When used strategically, such tools allow leaders to stop guessing and begin leading with evidence.
Because what gets measured does not just get managed. It gets improved.
Written by Aimee Bloom. Aimee is the Product Manager at the Institute of Positive Education. She is responsible for crafting the Institute’s Positive Education Enhanced Curriculum (PEEC) from ELC – 12. An experienced teacher and writer since 2005, Aimee has taught in both primary and secondary contexts, and has written content for a variety of government and non-government agencies. She is passionate about supporting teachers and ensuring the wellbeing of children, both in our schools and around the globe.
……………………………………………………………………………………
Further Reading and Resources
Mi7
Mi7 is a student wellbeing measurement tool designed specifically for schools, helping educators understand how students are really going across multiple dimensions of wellbeing. By turning student voice into clear, meaningful insights, Mi7 supports schools to make informed decisions that strengthen wellbeing where it matters most.
Impact Study – Wellbeing and Educational Outcomes
Oxford University Press published an impact study to better understand any potential links between wellbeing and academic attainment as well as other educational outcomes. The impact study was conducted by Dr. Ariel Lindorff, Departmental Lecturer in Research Methods, Department of Education, University of Oxford.
……………………………………………………………………………………
References
Boyes, A., & Hermens, D. F. (2026). Wellbeing Is Not the Absence of Psychological Distress: A Longitudinal Descriptive Analysis in Early Adolescence. The Journal of adolescent health : official publication of the Society for Adolescent Medicine, 78(1), 195–199. https://doi.org/10.1016/j.jadohealth.2025.09.002
Datu, J. A. D., & King, R. B. (2018). Subjective well-being is reciprocally associated with academic engagement: A two-wave longitudinal study. Journal of school psychology, 69, 100–110. https://doi.org/10.1016/j.jsp.2018.05.007
Kern, M. L., Waters, L. E., Adler, A., & White, M. A. (2015). A multidimensional approach to measuring well-being in students: Application of the PERMA framework. The journal of positive psychology, 10(3), 262–271. https://doi.org/10.1080/17439760.2014.936962
Kroenke, K., Spitzer, R. L., & Williams, J. B. (2003). The Patient Health Questionnaire-2: validity of a two-item depression screener. Medical care, 41(11), 1284–1292. https://doi.org/10.1097/01.MLR.0000093487.78664.3C
Löwe, B., Wahl, I., Rose, M., Spitzer, C., Glaesmer, H., Wingenfeld, K., Schneider, A., & Brähler, E. (2010). A 4-item measure of depression and anxiety: validation and standardization of the Patient Health Questionnaire-4 (PHQ-4) in the general population. Journal of affective disorders, 122(1-2), 86–95. https://doi.org/10.1016/j.jad.2009.06.019
Snyder, C. R., Hoza, B., Pelham, W. E., Rapoff, M., Ware, L., Danovsky, M., Highberger, L., Rubinstein, H., & Stahl, K. J. (1997). The development and validation of the Children’s Hope Scale. Journal of pediatric psychology, 22(3), 399–421. https://doi.org/10.1093/jpepsy/22.3.399
Spitzer, R. L., Kroenke, K., Williams, J. B., & Löwe, B. (2006). A brief measure for assessing generalized anxiety disorder: the GAD-7. Archives of internal medicine, 166(10), 1092–1097. https://doi.org/10.1001/archinte.166.10.1092
